
Introduction
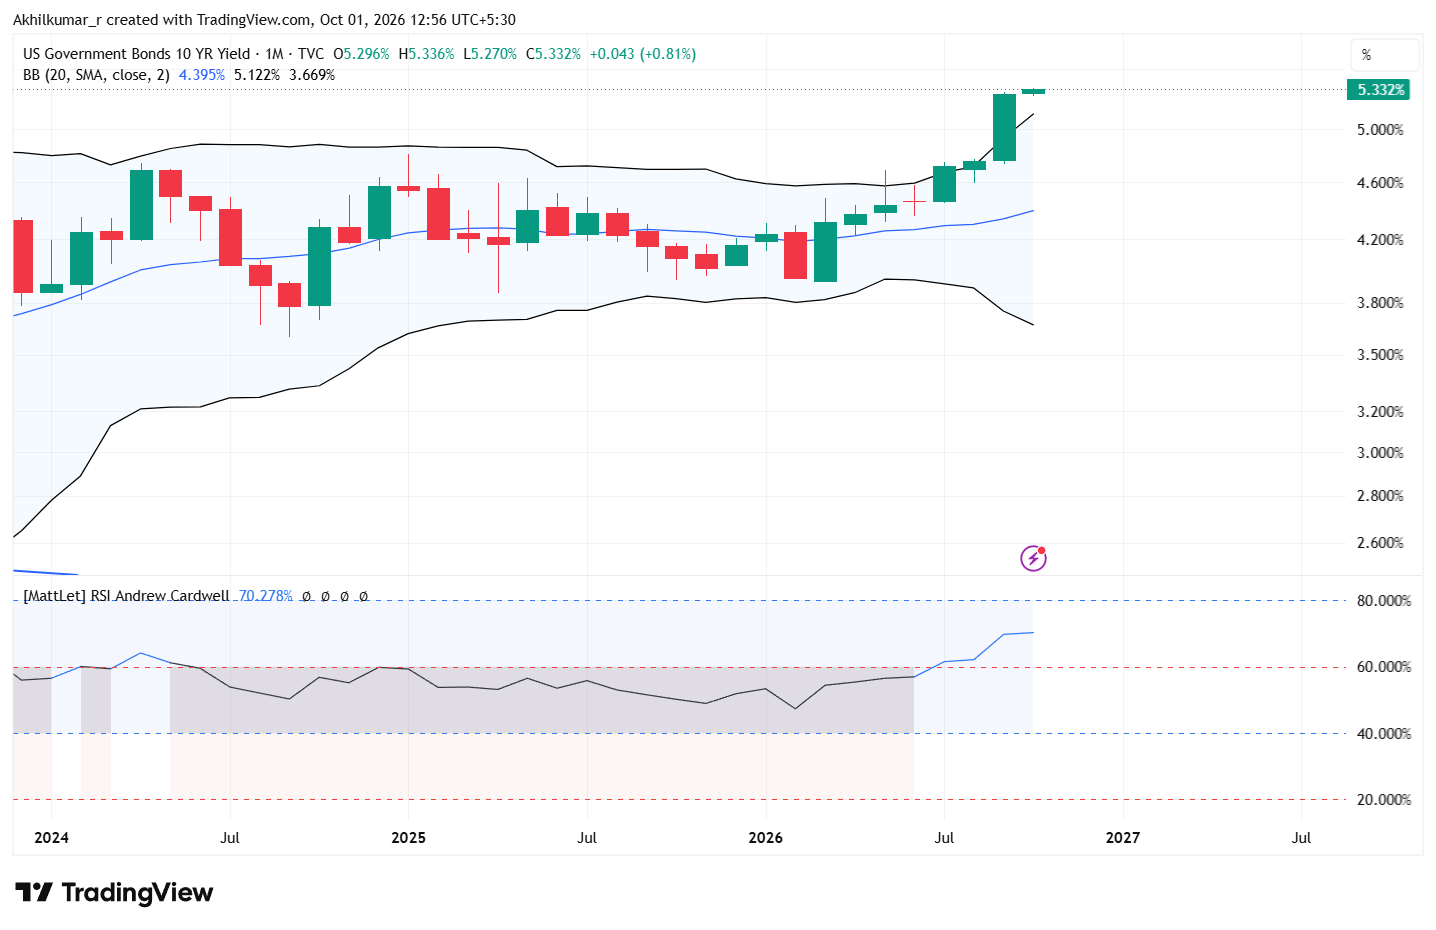
Looking at the current chart structure of the US 10-Year Treasury Yield, the yield has shown a strong upward move and is currently around 5.34%.
From a purely technical perspective, one possible scenario is that the yield could move significantly higher — even towards the 8% zone. However, this is only a technical assumption/scenario, not a forecast or certainty.
If US bond yields continue to rise sharply, it could create pressure on global equity markets because higher bond yields can make fixed-income assets relatively more attractive and increase the cost of capital.
For India, a sustained rise in US yields could also create additional pressure through global capital flows, currency movements and interest-rate expectations. If this eventually translates into higher domestic interest rates, the impact on equity valuations could become more significant.
From the Nifty technical-structure perspective, the key downside levels I would keep on the radar are approximately:
- 22,200 – first important support zone
- 21,700 – next support
- 16,850 – deeper structural support / extreme downside scenario
The important point is that the 8% US yield scenario should not be treated as a base-case prediction. It is a risk scenario derived from the chart structure. The actual market reaction would depend on why yields are rising, how quickly they rise, Federal Reserve policy, inflation expectations, the USD/INR movement and domestic RBI policy.
Disclaimer: This content is for educational and informational purposes only and should not be construed as investment advice, a recommendation, or a solicitation to buy or sell any security. The discussion on US bond yields and Nifty levels represents a technical analysis-based scenario and not a prediction or certainty. Markets are subject to volatility and multiple macroeconomic factors. Investors should conduct their own research and consult a qualified financial professional before making any investment decisions. Past performance is not indicative of future results.